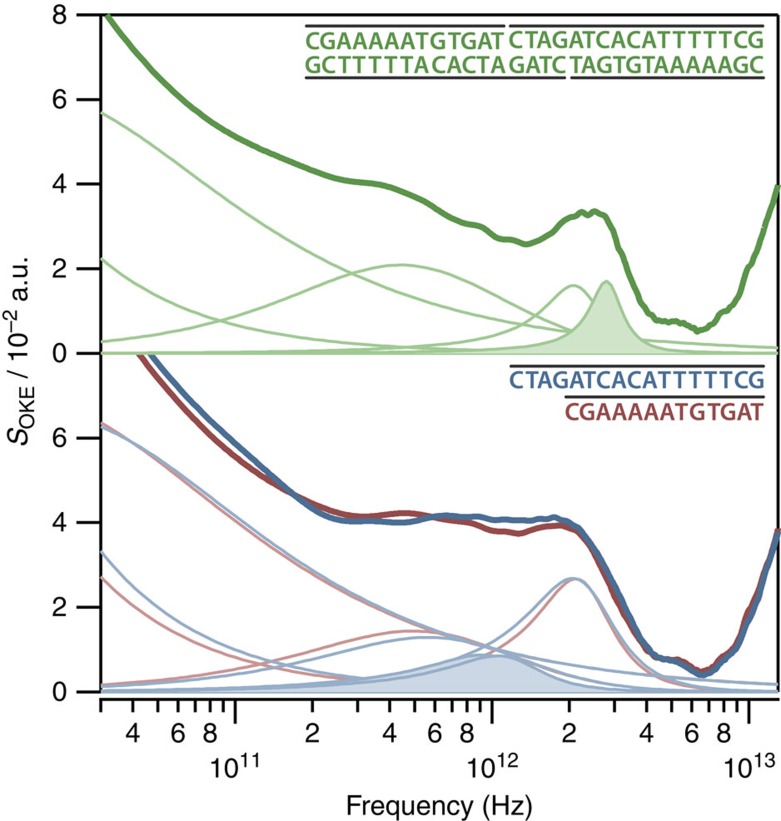
Figure 2. OKE spectra and fits for the solutions of the complementary oligomers of 13 and 17 bases dissolved together and separately.
Dissolved together (top) and separately (bottom, where the spectrum from the 13mer is shown in red and that of the 17mer in blue). The significant difference between top and bottom is the bands filled with colour. When the nucleic acids are single stranded, there is a band at 1.08 (13mer) and 1.20 THz (17mer). However, when they form a double strand, only a characteristic band at 2.83 THz appears.

