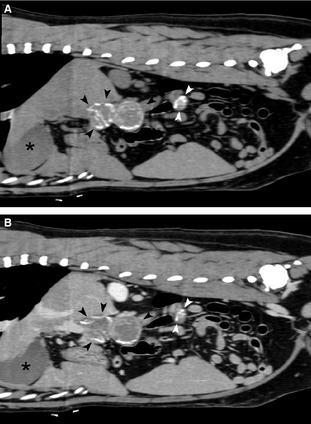
Figure 3.

(A, B) Follow‐up CT 20 months after diagnosis: Precontrast (A) and corresponding postcontrast (B) sagittal computed tomographic images of the abdominal cavity, soft‐tissue algorithm, slightly to the right of the midline. A progressive decrease in size and increase in mineral content predominantly in the lesions peripheries is evident. Mineralization of the mass wall is visible (black arrows). The gallbladder is indicated by the asterisk (*). Because of reduction in size, the lesions comprise 2 separate entities (black and white arrowheads).
