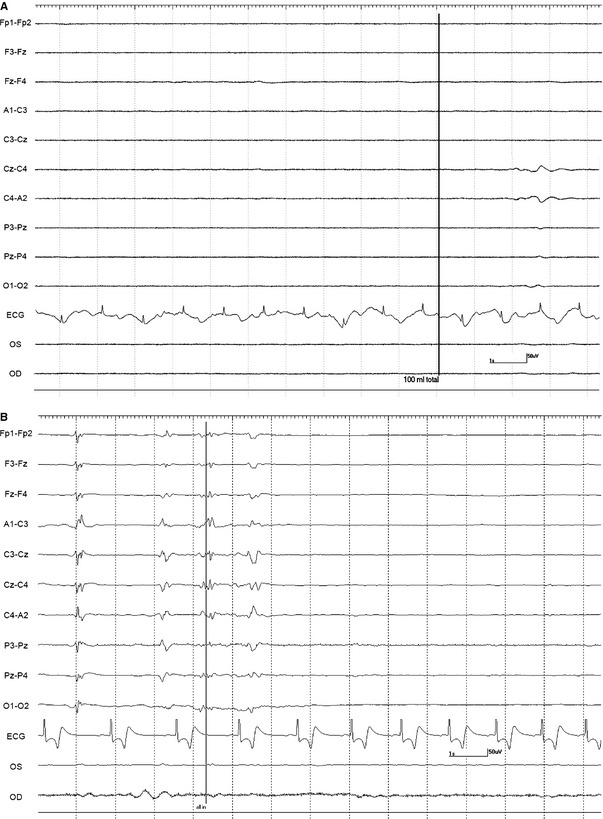
Figure 2.

Isoelectric recording. (2A) This EEG is isoelectric in horse 10 before the end of the infusion marked with black vertical line and labeled 100 mL total (volume of pentobarbital sodium solution). (2B) This EEG is showing isoelectric pattern 1.5 seconds after the end of the infusion marked with a black vertical line (labeled: all in) in horse 13 (see Fig 1. for Electroencephalogram details).
