
Fig. 2.
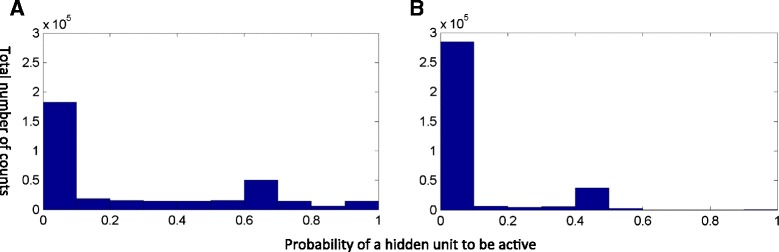
The histogram of the expected states of hidden units (probability of hidden units to be on) in the first hidden layer for the conventional autoencoder (a) and sparse autoencoder (b) respectively. For both models, the number of hidden units from the first hidden layer to the fourth hidden layer is 214, 100, 50, and 25 respectively. The sparsity threshold for the sparse autoencoder is 0.1. A hidden unit has a state under each experiment condition. Therefore, the total number of states for all hidden units is the number of experiment condition (1609) * the number of hidden units (214). The x-axis is the probability of a hidden unit to be on ranging from 0 to 1. The y-axis is the count of states