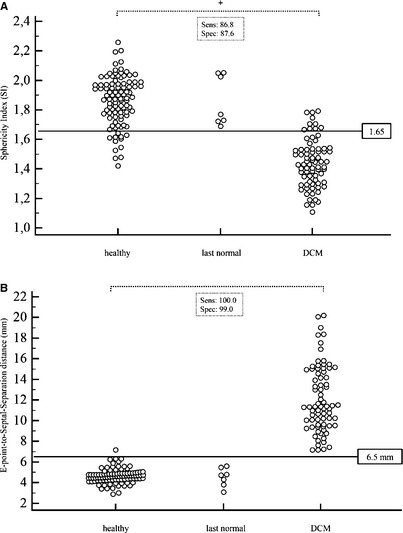
Figure 4.

Dot diagram of the SI (A) and EPSS (B) on the y‐axis and the different groups on the x‐axis. The horizontal line denotes the estimated cutoff value to distinguish healthy dogs from dogs with DCM. There was a significant difference between DCM and control group (P < .001). Sensitivity and specificity are displayed.
