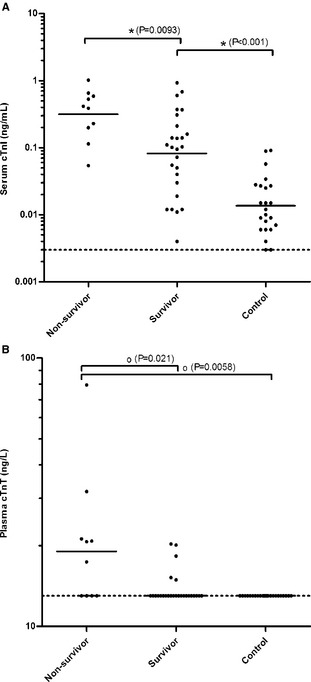
Figure 1.

Serum cTnI (A) and plasma cTnT (B) concentrations of 36 cats with HCM (nonsurvivors and survivors) at admission and of healthy control cats. Geometric mean concentrations (A) for Gaussian and median concentrations (B) for non‐Gaussian data are shown as horizontal lines. Statistically significant differences between groups are symbolized with * (two‐tailed t‐test) and o (Mann–Whitney U‐test).
