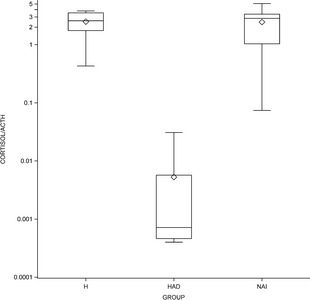
Figure 3.

Box and whiskers log scale plot comparing cortisol:ACTH ratio (CAR) among the 3 groups (H = healthy, NAI = nonadrenal illness, HAD = hyperadrenocorticism). The box represents the interquartile range from the 25th to 75th percentile, the horizontal bar through the box represents the median, the diamond in the box represents the mean, and the whiskers represent the minimum and maximum values (range).
