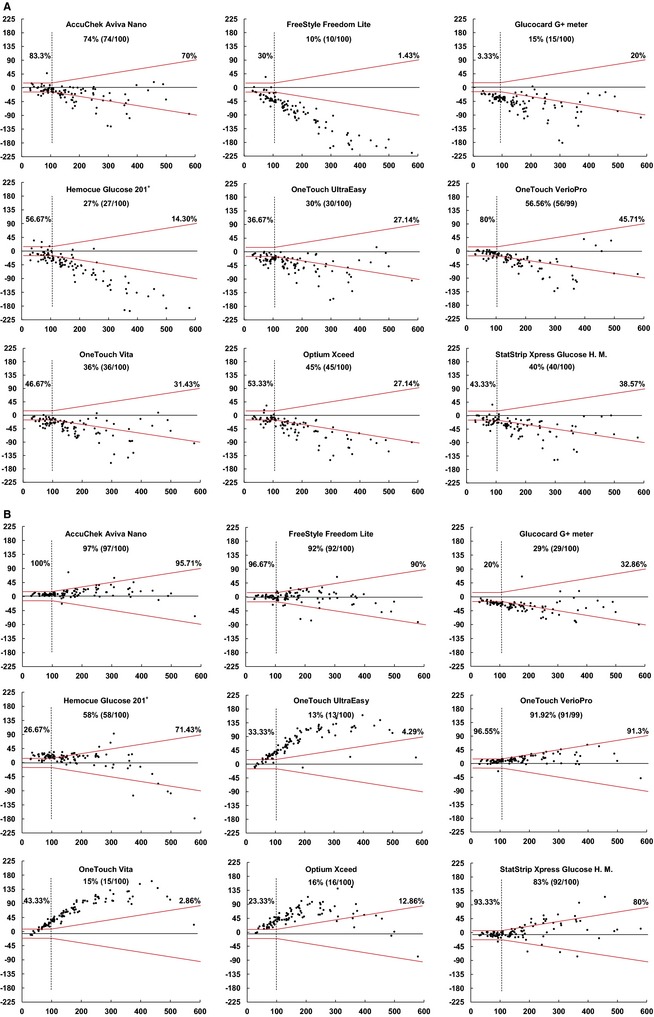
Figure 1.

Bland‐Altman plots representing accuracy of portable blood glucose meters for whole blood (A) and plasma (B) for ISO 15197:2013. On the x axis, are the reference glucose values, plotted against the absolute errors for each corresponding value. The standard required limits defined by the red symmetric lines: at ±15 mg/dL from the reference value for glucose determinations <100 mg/dL and at ±15% from the reference for glucose ≥100 mg/dL. Percentages express the number of samples within limits when reference was < or ≥100 mg/dL and for the total number of measurements (central% value).
