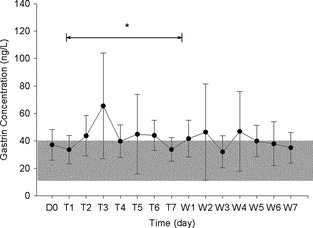
Figure 1.

Mean (±SD) serum gastrin concentrations from 9 dogs at baseline (D0), and from 8 dogs during famotidine administration (Days T1–T7) and withdrawal (Days W1–W7). The line indicates the days of drug administration data considered as a block. *Indicates significant difference between baseline and during drug administration, and between withdrawal and during drug administration. Shaded area represents reference range of 10–40 ng/L.
