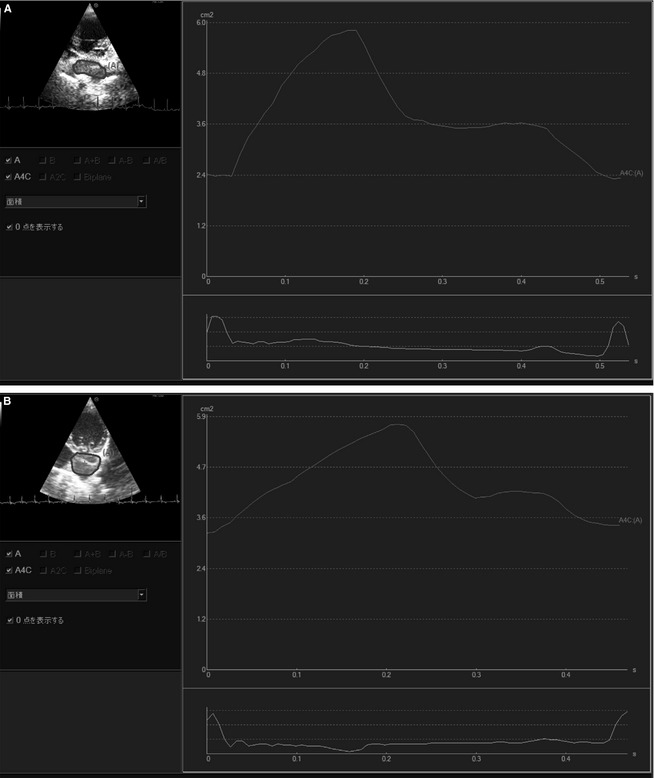
Figure 1.

Time‐left atrial area curves of a dog in Group A (A) and Group B (B). The upper graph represents the time‐left atrial area curve and the lower represents the ECG tracing. The dog in Group B has a lower LA‐FACtotal and LA‐FACact than the dog in Group A.
