
Figure 4.
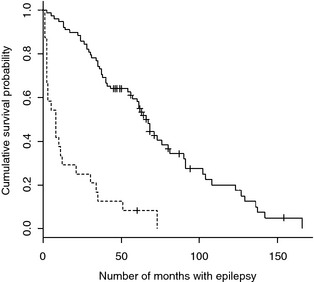
Kaplan–Meier plot of survival time in dogs with idiopathic epilepsy and epilepsy associated with a known intracranial cause. Solid line = dogs with idiopathic epilepsy (n = 78). Dashed line = dogs with epilepsy associated with a known intracranial cause (n = 24). Hash marks indicate censored data.