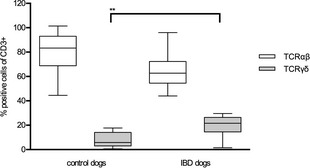
Figure 4.

Distribution of TCR (T‐cell receptor)αβ+ and TCRγδ+ T‐cells within intestinal intraepithelial lymphocytes (IEL). Box and whisker plots show TCRαβ and yδ expression within IEL from controls dogs (n = 10) and dogs with inflammatory bowel disease (IBD; n = 10). Each box and whisker plot illustrates the median and quartiles (**P < .01).
