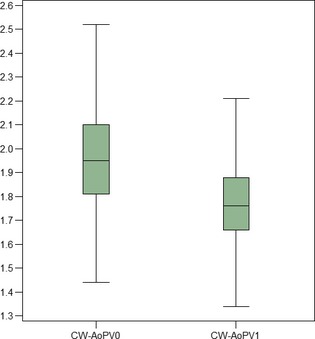
Figure 3.

Boxplot of the CW‐AoPV at T0 and T1 in normal Boxers, showing the interquartile range (IQR) and highlighting median, in the box. The whiskers run from the quartile to the minimum/maximum observation below lower/upper fence defined as 1.5 × IQR. Aortic peak velocity at T0 is significantly greater than AoPV1 (P < .0001).
