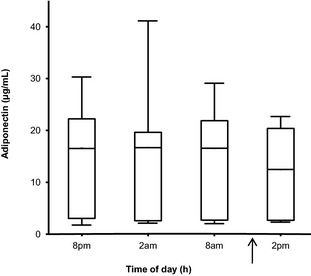
Figure 3.

Plasma adiponectin concentration in 9 Beagles during a 24‐hour period. Medians are indicated by the midline; first and third quartiles by the open box; and minima and maxima by the lower and upper whiskers. Arrow represents the feeding time (11 am).
