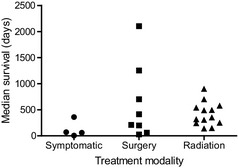
Figure 2.

Median survival times associated with treatment using different modalities. This plot was compiled from data included in references.10, 11, 20, 24, 25, 26, 27, 28, 30, 31, 32, 33, 34, 35, 36, 37, 38, 39, 40, 45, 46 The data included in references31 and 32 have been subdivided into two points because the summary data was unavailable.
