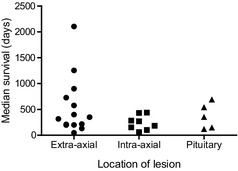
Figure 3.

Median survival time associated with masses located at different sites within the skull. This plot was compiled from data included in references.20, 25, 26, 27, 28, 29, 30, 31, 32, 33, 34, 37, 38, 39, 40, 45 Reference35 (Kent et al is not included here because the treated group did not have a median survival).
