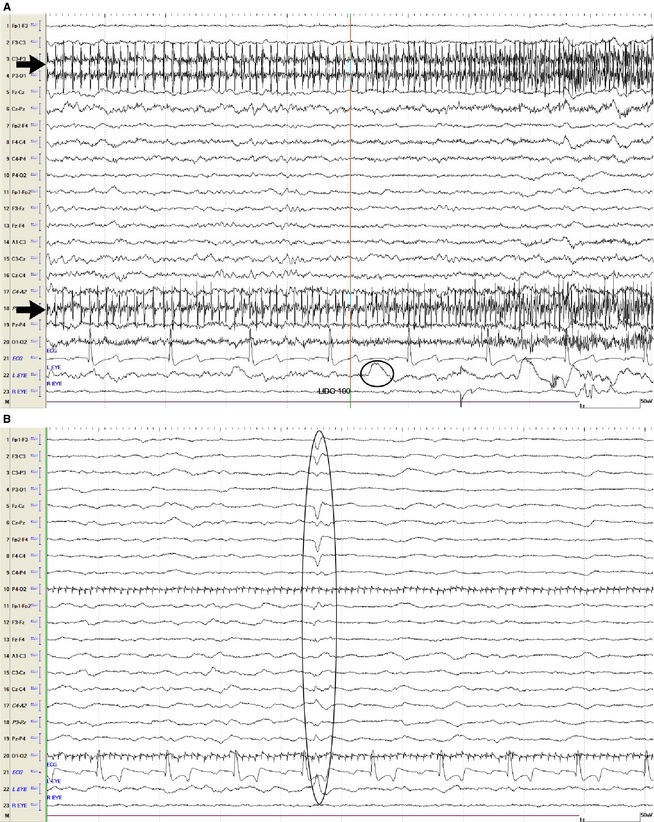
Figure 1.

(A) This EEG recording is depicting the end of the intrathecal infusion with 100 mL of lidocaine (line labeled as lido 100 marks the end of the infusion). Muscle (black arrows) and eye (black oval) movement can be seen. (B) EEG becoming isoelectric. Note the artifact of an agonal breath (oval) concurrently with loss of brainstem reflexes. Muscle (motor unit) artifact is apparent. For all figures showing electroencephalogram: Even numbers = right side, odd numbers = left side, z = midline. Fp = frontopolar, F = frontal, C = central, P = parietal, O = occipital, A = aural, EOG: right eye or left eye, ECG. Calibration bar shown is for EEG and EOG = 1 second (second), 50 µV (microvolts). Calibration bar for ECG is not shown.
