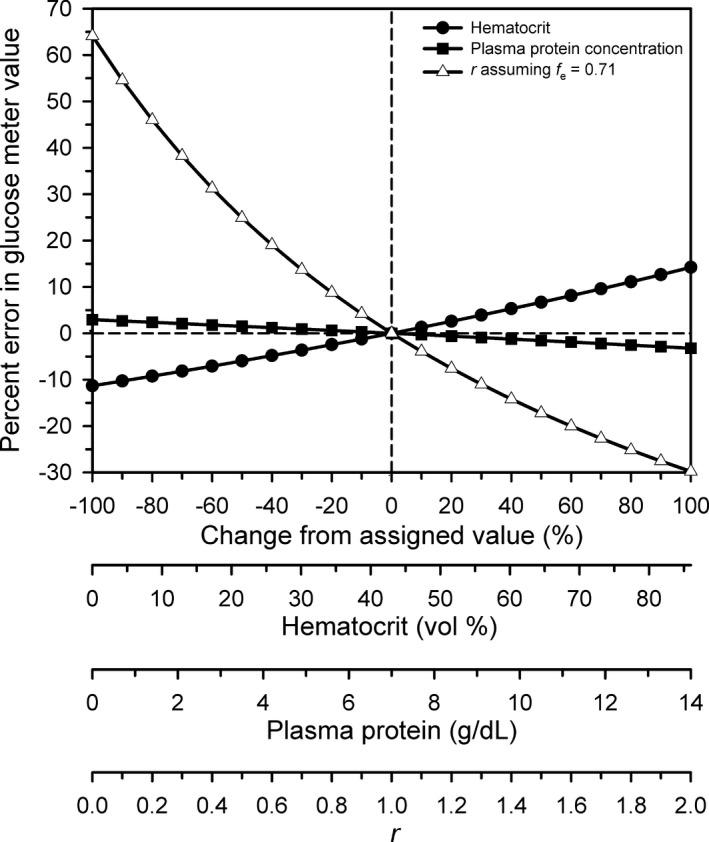
Figure 5.

Spider plot revealing the dependence of percent error reading by an electrochemical point‐of‐care glucose meter on changes in the four independent variables (hematocrit, plasma protein concentration, r, and f e). The spider plot was obtained by systematically varying one independent variable while holding the other three independent variables at their assumed values for human blood. Reference values for the four independent variables were as follows: hematocrit = 43% (filled circles), plasma protein concentration = 7.0 g/dL (filled squares); r = 1.0 (open triangles); f e = 0.71 (open triangles, same scale as r on the x axis). The dashed vertical and horizontal lines indicate that the percent error = 0% when hematocrit, plasma protein concentration, r, and f e are at their reference values.
