
Figure 3.
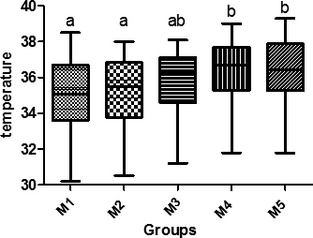
Thermographic temperature comparison between mammary glands in the control group. M1: cranial thoracic mammary glands; M2: caudal thoracic mammary glands; M3: cranial abdominal mammary glands; M4: caudal abdominal mammary glands; M5: inguinal mammary glands. Different letters mean there is a statistically significant difference by Tukey's test (P < .05).