
Figure 4.
Thermographic temperatures in M1, M2, and M3 in the control and tumor groups. *Statistically significant difference between groups (P < .05).
Official websites use .gov
A
.gov website belongs to an official
government organization in the United States.
Secure .gov websites use HTTPS
A lock (
) or https:// means you've safely
connected to the .gov website. Share sensitive
information only on official, secure websites.
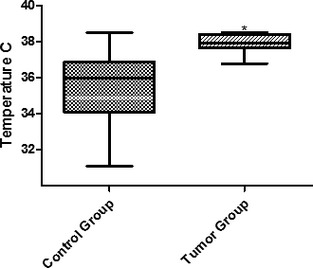
Thermographic temperatures in M1, M2, and M3 in the control and tumor groups. *Statistically significant difference between groups (P < .05).