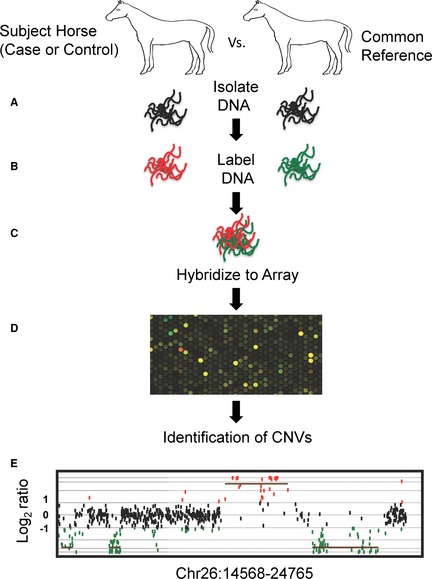
Figure 2.

Comparative genomic hybridization method to identify CNVs in horses. (A) Genomic DNA is isolated from subject horses (cases and controls) and a single reference horse. (B) Genomic DNA from the subject horses are independently labeled with a red dye and genomic DNA from a single reference horse is labeled with a green dye. (C) Labeled DNA from a single subject horse and the reference horse are mixed together at equal ratios and competitively hybridized onto a comparative genomic hybridization array. (D) Fluorescent image of array after hybridization of subject and reference DNA. The spots on the array represent individual oligonucleotides. Yellow spots reflect regions with equal DNA content, and red and green spots reflect unequal ratios of DNA between the subject and reference horse, respectively. (E) Plot of normalized log2 ratios of oligonucleotides on the array. The Y‐axis represents normalized log2 ratios of fluorescent signals for each spot on the array. The X‐axis represents the relative genomic coordinates of each oligonucleotide. For example, a log 2 ratio <1 and >‐1 (black dots) indicates equal DNA content between the subject and reference horses. A log2 ratio >1 and <‐1 indicates unequal DNA content between the subject and reference horses.
