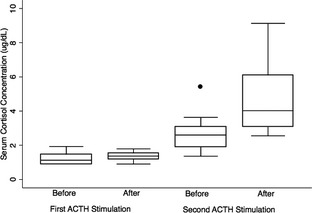
Figure 1.

Box and Whisker plot of serum cortisol concentrations before and after two ACTH stimulation tests performed on the same day 3–6 hours after trilostane was administered (first stimulation in red and blue) and 9–12 hours after trilostane was administered (second stimulation in green and orange). The line within the box represents the median, the box represents the interquartile range, whiskers represent the most extreme values within 1.5 of the nearer quartile, and the single point represents an outlier. Cortisol concentrations <1 μg/dL were assigned a value of 1 μg/dL.
