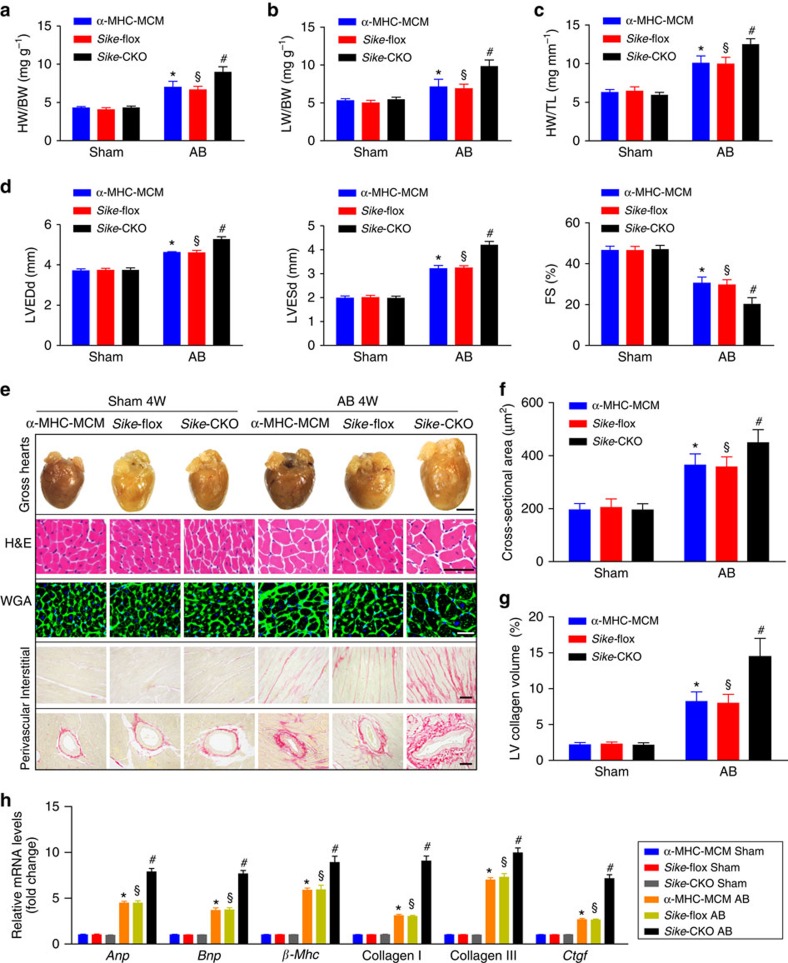
Figure 2. Sike deficiency in the heart promotes pressure overload-induced hypertrophy.
(a–c) Comparison of the HW/BW (a), LW/BW (b) and HW/TL (c) ratios in different genotypic mice (α-MHC-MCM, Sike-flox and Sike-CKO) after sham or AB surgery, n=12–15 mice/group. (d) Comparison of echocardiographic parameters (LVEDd, LVESd and FS) in the indicated groups, n=10–12 mice per group. (e) Histological analyses of whole hearts (the first row; scale bar, 2,000 μm) and heart sections stained with H&E (the second row; scale bar, 50 μm), WGA (the third row; scale bar, 20 μm) or PSR (the fourth and fifth row; scale bars, 50 μm) from the indicated groups 4 weeks after sham or AB surgery, n=6–8 mice per group. (f) Comparison of the average cross-sectional area of cardiomyocytes from the indicated groups, n≥100 cells per group. (g) Comparison of the LV collagen volume in the indicated groups, n≥40 fields per group. (h) mRNA levels of the hypertrophic marker genes (Anp, Bnp and β-Mhc) and fibrotic marker genes (collagen I, collagen II and Ctgf) in the indicated groups, n=4 independent experiments. *P<0.05 versus the sham-operated α-MHC-MCM group; §P<0.05 versus the sham-operated Sike-flox group; #P<0.05 versus the AB-operated α-MHC-MCM or Sike-flox group in a–d, f–h. Data are presented as the mean±s.d. from at least three independent experiments. Statistical analysis was carried out by one-way analysis of variance.

