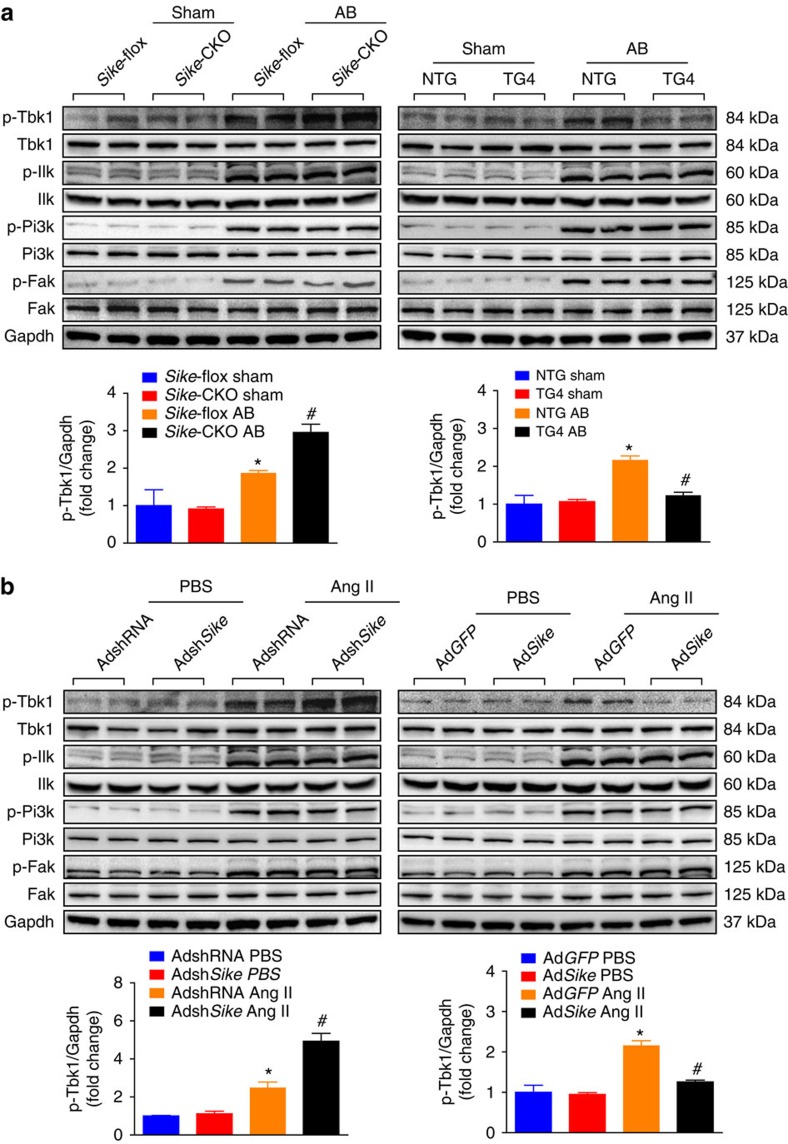
Figure 6. The TBK1-AKT axis is involved in SIKE-regulated cardiac hypertrophy.
(a) Immunoblots (top) and quantification (bottom) of the active levels of the signaling molecules that regulate the AKT pathway (e.g., Tbk1, Ilk, Pi3k and Fak) in the hearts of different Sike genotypic mice (Sike-flox and Sike-CKO, NTG and TG4) 4 weeks after sham or AB surgery, *P<0.05 versus the sham-operated Sike-flox or NTG group, #P<0.05 versus the AB-operated Sike-flox or NTG group. n=4 mice per group. (b) Immunoblots (top) and quantification (bottom) of the activities of the signaling proteins upstream of Akt in cultured NRCMs infected with AdshRNA or AdshSike, AdGFP or AdSike, followed by PBS or Ang II treatment. *P<0.05 versus the PBS-treated AdshRNA- or AdGFP-infected group; #P<0.05 versus the Ang II-treated AdshRNA- or AdGFP- infected group. Data are presented as the mean±s.d. from at least three independent experiments. Statistical analysis was carried out by one-way analysis of variance.

