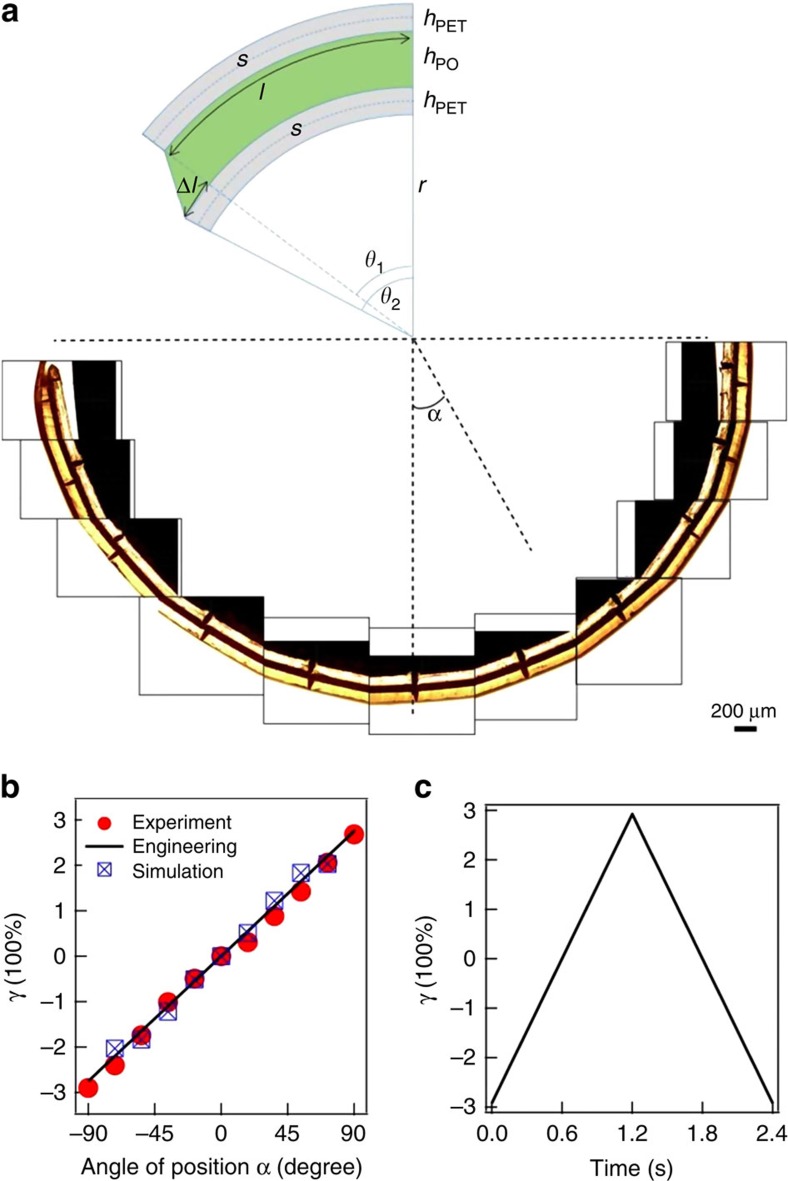
Figure 3. Schematic of sandwich theory.
(a) Experimental measurements of the shear strain distribution after bending the sandwich composite film onto a cylinder, images taken with an optical microscope in bright field. A montage of images from different positions of the film is shown, with α being the position angle. The bright strips are PET foils, while the dark region in between is the PO film. The relative shifts between the marks on the top PET foil and the bottom PET foil indicate shear strain at different positions. The angular interval between the marks is ∼18°. (b) Experimental and Abaqus simulation results of γ distribution across the PO film with BIOS as a function of position angle (α) compared with the engineering approximation. Abaqus simulations performed with ratio between Young's modulus of PET and PO, RE=1,000, where result has been corrected for the true thickness in simulation. (c) Change of the shear strain inside the PO film within one oscillation, using an engineering approximation.

