
Figure 7.
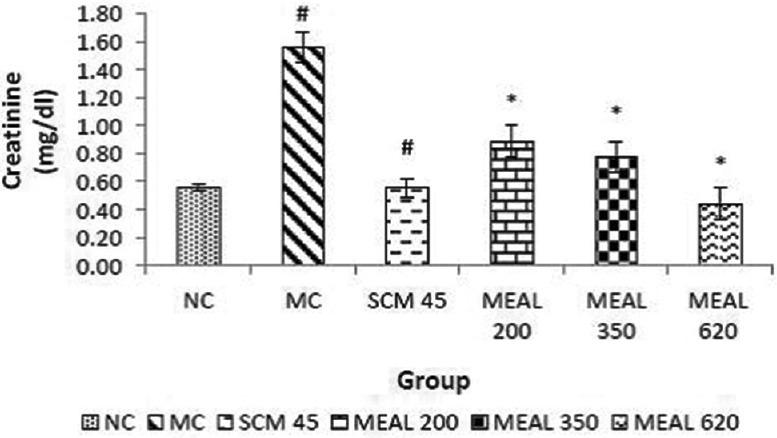
Effect on serum creatinine level: Data are represented as mean ± SEM, n = 6; #P < 0.05 as compared to normal control (group I); *P < 0.05 as compared to model control (group II), NC: Normal control, MC: Model control, SCM 45: Standard control metformin 45 mg/kg, MEAL 200, 350 and 620 – Methanol extract of Albizzia lebbeck 200, 350 and 620 mg/kg respectively