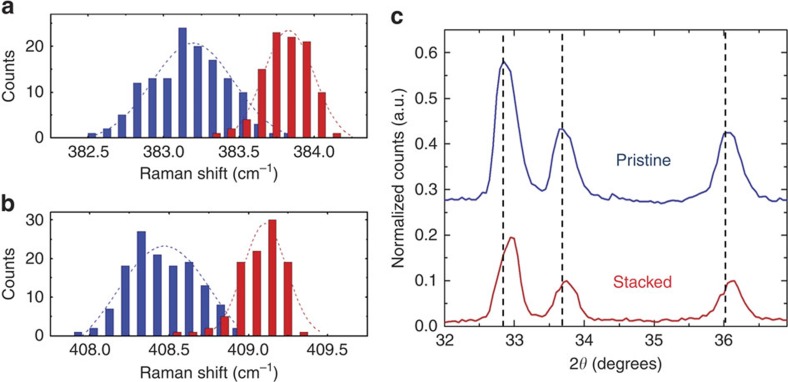
Figure 2. Interface strain in vertically stacked 2D C-MoS2 nanosheets.
Distributions from Raman spectroscopy maps comprising>100 individual scans showing average shifts in the MoS2 (a) E2g and (b) A1g modes due to strain induced by a lattice mismatched carbon-MoS2 interface. The dotted lines overlaying each distribution represent Gaussian fits to the distribution data. (c) X-ray diffraction analysis of vertically stacked C-MoS2 nanosheets indicating stacking-induced strain in low-index planes. The following planes can be assigned to the X-ray diffraction spectra: 2θ=32.6° is (100), 2θ=33.5° is (101) and 2θ=35.8° is (102). The vertical dotted lines emphasize the difference in peak positions between the two spectra.

