
Fig. 6.
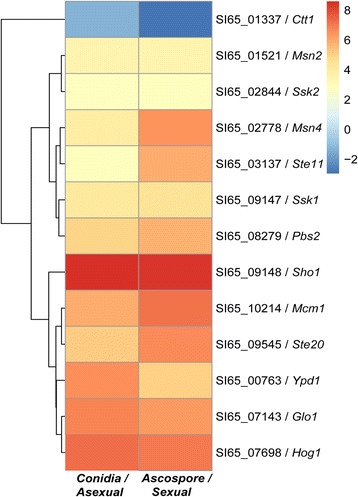
Expression of HOG MAPK pathway genes according to osmolarity. Thirteen genes of the HOG pathway are shown, and background colour changes from blue to red indicate changes in log2 FPKM values (−2, 0, 2, 4, 6, 8; upper right) of gene expression levels under low and high osmolarity conditions. Numbers at right, such as SI65_01337/Ctt1, are Gene IDs or names. Treatment conditions are detailed beneath the images