Fig. 2.

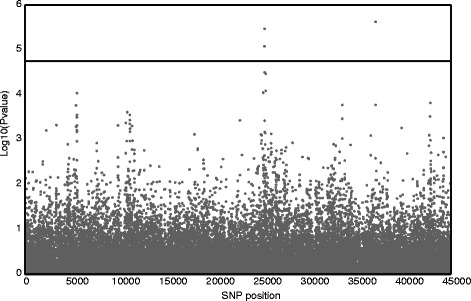
GWAS results for early vigor in the Flint panel. The graph represents -log10(P-values) of the 35963 SNPs tested. The line shows the significant threshold of -log10(P-values)

GWAS results for early vigor in the Flint panel. The graph represents -log10(P-values) of the 35963 SNPs tested. The line shows the significant threshold of -log10(P-values)