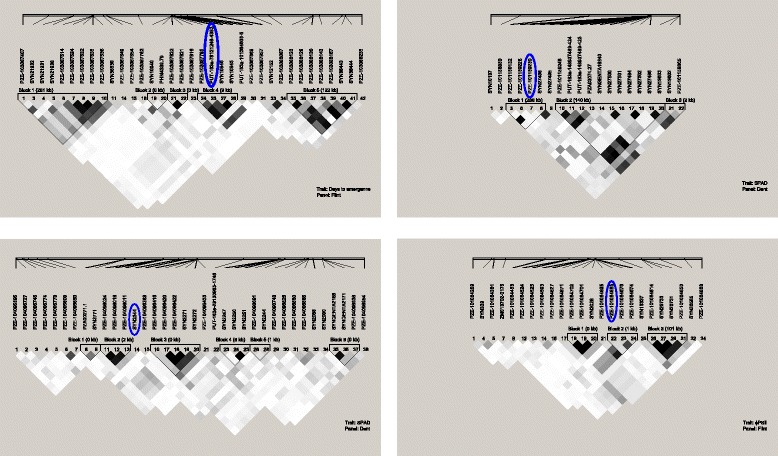
Fig. 3.

Local LD, measured as rr values between pairs of SNPs (white, r 2 = 0; shades of gray = 0 < r2<, 1; black r2 = 1), and haplotype blocks for a 1.4 -kb genomic region that surrounds significant SNPs associated to cold tolerance traits in two association panels of maize inbred lines evaluated under control and cold conditions
