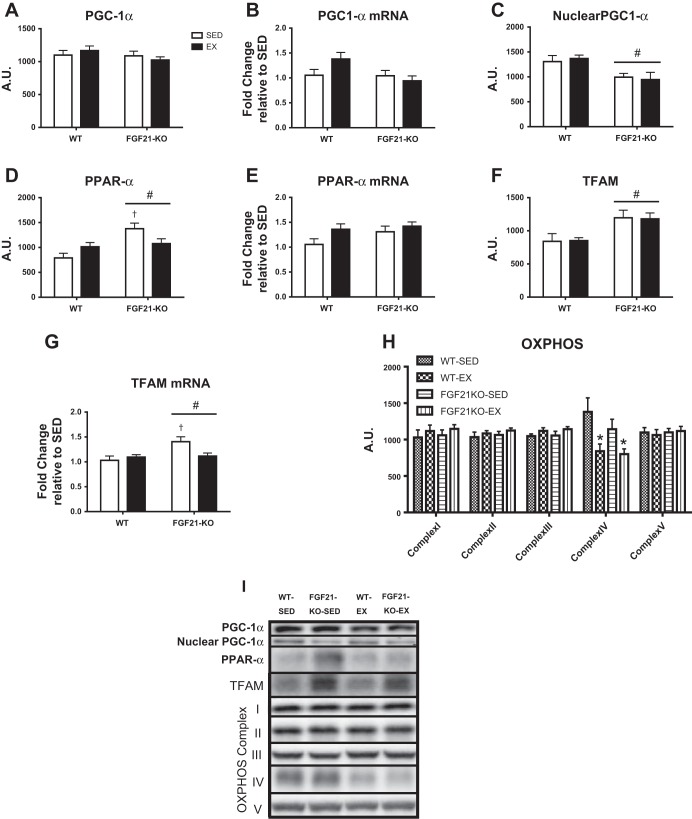
Fig. 4.
Effects of exercise and/or absence of FGF21 on PGC-1α protein content (A), PGC-1α mRNA expression to WT-SED (B), PGC-1α protein content found in the nucleus (C), PPARα protein content (D), PPARα mRNA expression to WT-SED (E), TFAM protein content (F), TFAM mRNA expression to WT-SED (G), and oxidative phosphorylation (H). Representative Western blots shown in I. Representative images do not reflect the order in which they appear in the graphs. WT, wild-type; FGF21-KO, FGF21 knockout; SED, sedentary; EX, exercise. Values are means ± SE (n = 9–15). #Significant genotype main effect, P ≤ 0.05; †significant differences vs. WT-SED and FGF21KO-EX, P ≤ 0.05. A.U., arbitrary units.

