
Figure 1.
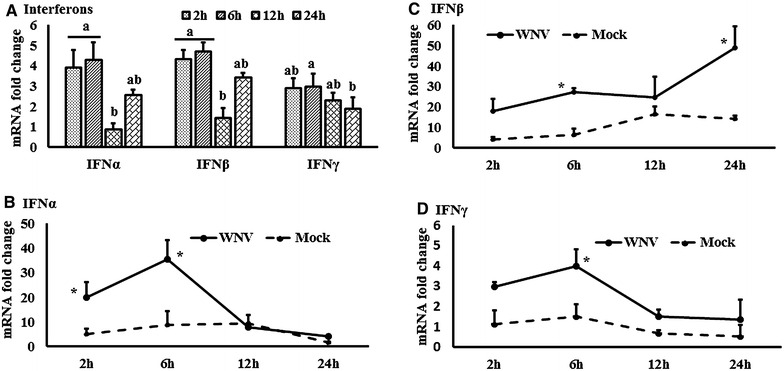
Expression kinetics of interferons mRNA. A Interferons expression in fold change. The ∆∆Ct values were calculated by subtracting the ∆Ct of genes in mock-inoculated PBMCs. The bar graph showed the expression of genes in WNV-infected PBMCs over mock-inoculated PBMCs (fold change: the normalised expression value of a gene in WNV-stimulated cells/the normalised expression value of a gene in mock-inoculated cells). Bars without common superscripts (A, B) denote statistical significant difference among time points (P < 0.05). B–D Relative expression of interferons mRNA, accounting for the effects of culture conditions on gene transcription in WNV- and mock-inoculated equine PBMCs. To compare the normalised expression of interferon genes from PBMCs harvested at each time point to their respective expression levels before either WNV- or mock- inoculation, the ∆∆Ct values were calculated by subtracting ∆Ct of genes in fresh-isolated PBMCs from the ∆Ct of genes in WNV- or mock- inoculated PBMCs at each time-point (for WNV-stimulated PBMCs, ; and for mock-inoculated PBMCs, ). *P < 0.05.