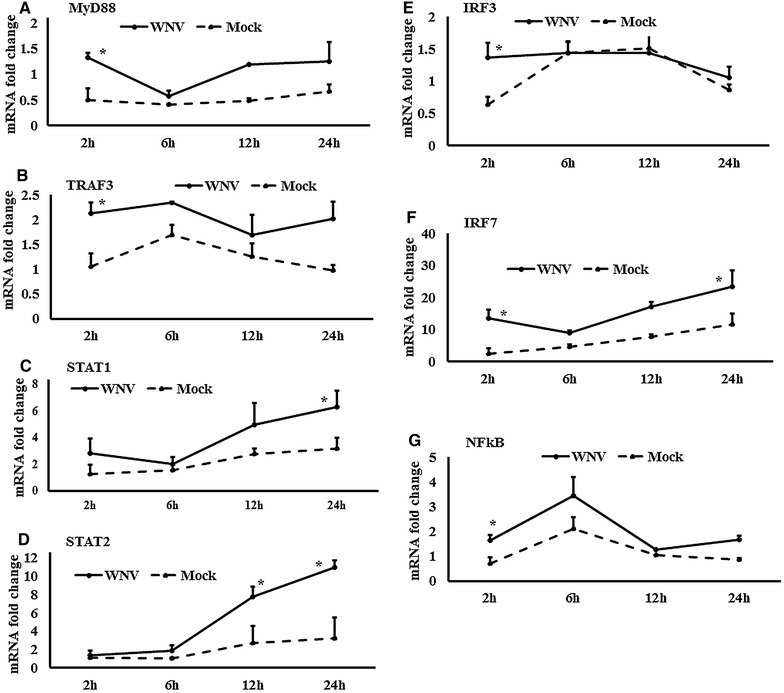
Figure 4.

Expression kinetics of TLR-associated genes transcriptions. A–G Relative expression of mRNA for TLRs-associated downstream genes, accounting for the effects of culture conditions on gene transcription in WNV- and mock-inoculated equine PBMCs. To compare the normalised expression of TLRs-associated genes from PBMCs harvested at each time point to their respective expression levels before either WNV- or mock- inoculation, the ∆∆Ct values were calculated by subtracting ∆Ct of genes in fresh-isolated PBMCs from the ∆Ct of genes in WNV- or mock- inoculated PBMCs at each time-point (for WNV-stimulated PBMCs, ; and for mock-inoculated PBMCs, ). *P < 0.05.
