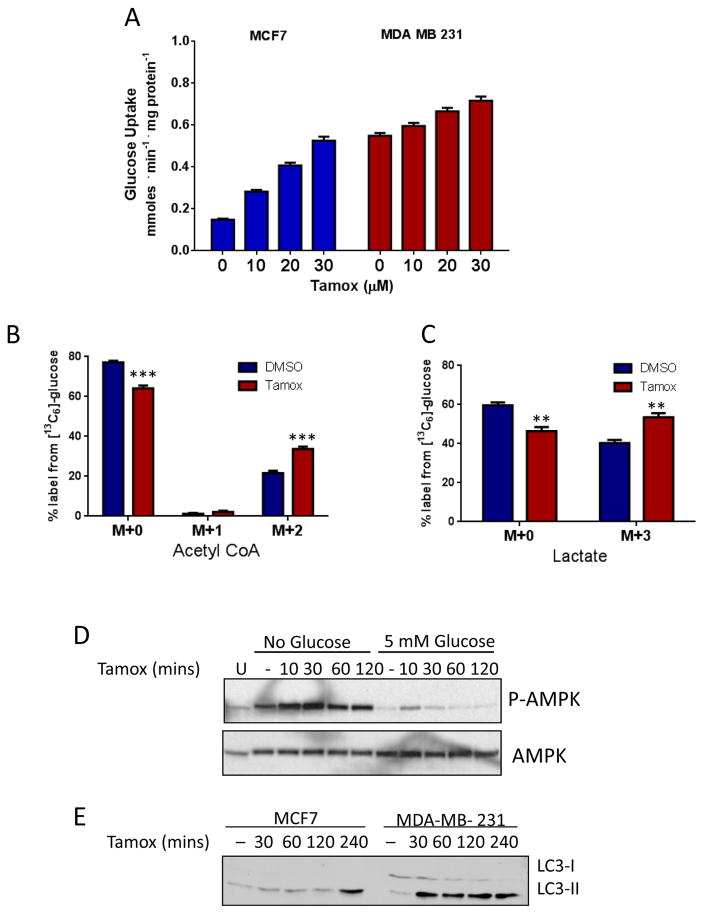
Figure 3. Tamoxifen treatment promotes glycolysis and alters fatty acid metabolism.
A. Glucose uptake from media following tamoxifen treatment for 1 hour in MCF7 and MDA-MB-231 cells. Data are the average of three independent experiments ±SEM *P<0.05 **P<0.01 ***P<0.001. LC-MS/MS analysis of 13C6-glucose metabolites after 30μM tamoxifen treatment for 1 hour in MDA-MB-231 cells: Mass isotopomer analysis of B. Acetyl CoA and C. Lactate. N=4, **P<0.01 ***P<0.001. D. Immunoblot analysis of phos-AMPK and total AMPK of cells treated with 20μM tamoxifen over time under glucose deprivation or 5mM glucose. E. Immunoblot analysis of LC3-I and LC3-II in BC cells after tamoxifen treatment.

