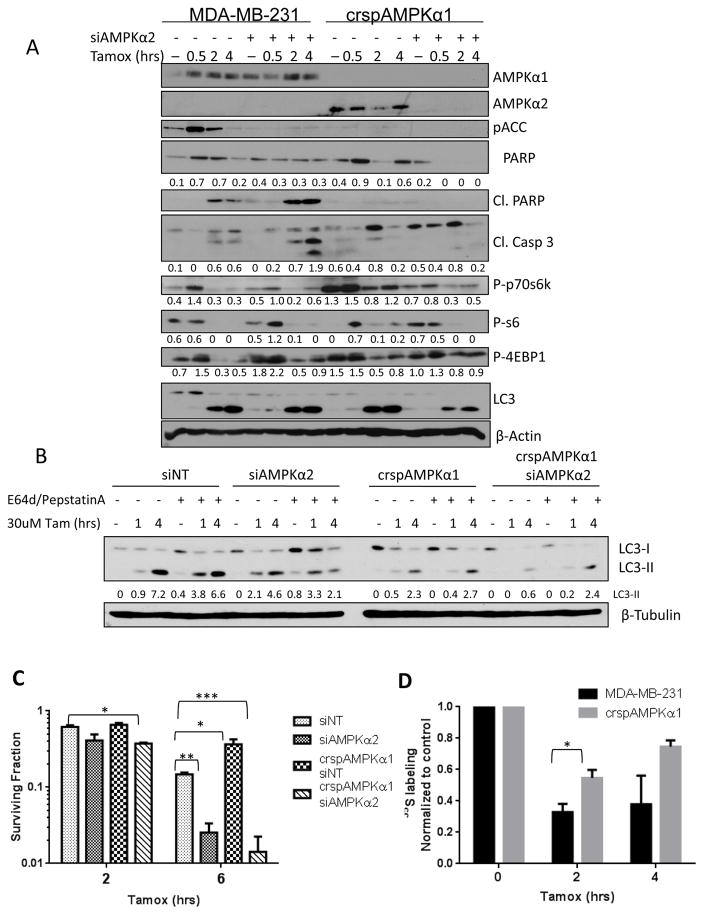
Figure 4. AMPKα1 and AMPKα2 mediate divergent effects on downstream effectors and cellular survival after tamoxifen treatment.
A. Immunoblot blot of AMPK pathway activation and apoptotic markers after tamoxifen treatment. Values below blots represent pixel intensity normalized to loading control, β-Actin. B. Immunoblot of LC3-I and LC3-II flux with tamoxifen treatment as affected by AMPK status. Values represent Pixel intensity of LC3-I (top) or LC3-II (bottom) normalized to untreated control. C. Survival of AMPK knock down cells treated with 30μM tamoxifen for 4 hrs. Data are the average of four independent experiments ±SEM *P<0.05 **P<0.01 ***P<0.001C. D. Quantification of 35S labeling after tamoxifen treatment in MDA231 cells and AMPK CRISPR knock out cells. Data are the average of three independent experiments ±SEM *P<0.05.

