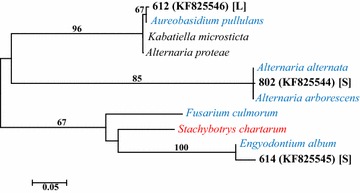
Fig. 2.

Maximum likelihood phylogenetic tree derived from alignments of ITS1 sequences. The best-fit nucleotide substitution model for the sequence dataset, based on the corrected Akaike (AICc) and Bayesian Information Criteria (BIC), was determined using MEGA v. 6 [39]. Hierarchical likelihood ratio tests ascertained that the Kimura 2-Parameter substitution model with invariant rate differences among sites was the optimal evolutionary model for phylogenetic inference. Fungal sequences collected from samples are in bold black font, labeled with the patient ID followed by NCBI (GenBank) accession numbers in parentheses. Genus and species are provided for the reference sequences. Red font indicates a known human pathogen, and blue font indicates species that have been documented as opportunistic pathogens in immunocompromised patients. Bootstrap values (1000 replications) are provided to indicate support levels for tree nodes. Unlabeled branches have bootstrap values below 50 %. Specimen type: [L] = BAL bronchoalveolar lavage, [S] sputum
