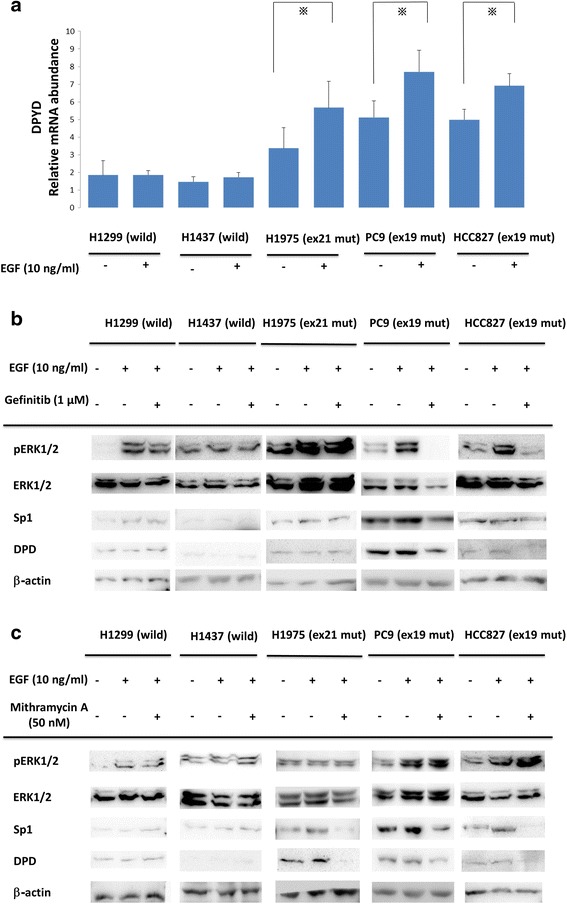
Fig. 2.

a Comparisons of DPD mRNA expression with EGF administration in NSCLC cell lines. Serum-free cells were incubated in the presence or absence of 10 ng/ml EGF. After that, DPD mRNA levels were quantified by RT-PCR. The experiment was performed in triplicate. *, p < 0.05 b, c NSCLC cell lines were treated with gefitinib (1 μM) or mithramycin A (50 nM) for 24 h followed by stimulation with 10 ng/ml EGF for 20 min. Extracted lysates were examined by western blotting. Results are representative of two independent experiments
