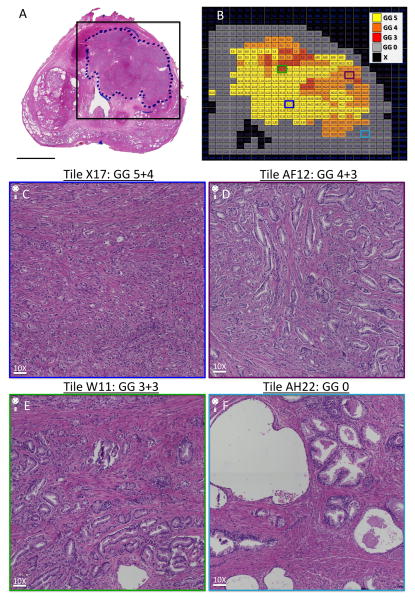
Fig. 1. “Digital prostate map” histopathological section and example grid overlay.
(A) H&E-stained WM histopathological prostate with a black box surrounding tumor ROI that represents the boundaries of a grid for sectioning the tumor area into voxel-sized tiles for grading purposes. Scale bar = 1 cm. (B) H&E-stained WM histopathological prostate section reconstructed into a “digital prostate map” interface online. Alphanumeric grid represents the outlined box in (A) surrounding the tumor ROI. Gleason grade is coded by color as defined by the key. (C) Representative tile (X17), showing Gleason grade 5+4 = 9 tumor architecture at 10X magnification. Scale bar = 75.5 μm. (D) Representative tile (AF12), showing Gleason grade 4+3 = 7 tumor architecture at 10X magnification. Scale bar = 75.5 μm. (E) Representative tile (W11), showing Gleason grade 3+3 = 6 tumor architecture at 10X magnification. Scale bar = 75.5 μm. (F) Representative tile (AH22), showing benign architecture at 10X magnification. Scale bar = 75.5 μm. Abbreviations: GG, Gleason grade; H&E, haematoxylin & eosin; ROI, region of interest; WM, whole mount.

