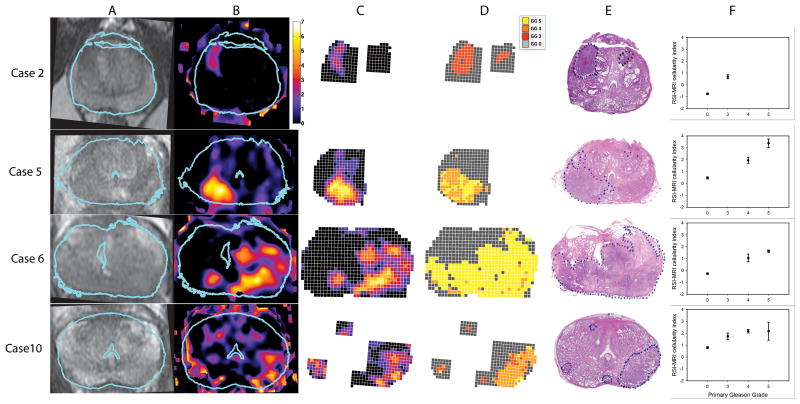
Fig. 2. T2, RSI-MRI, Gleason grade, and H&E: Cases 2, 5, 6, and 10.
A) T2-weighted MR images, after in-plane affine transformation to correspond to the histopathology slides, B) RSI-MRI color coded cellularity maps, C) “Digital prostate map” grid overlay color-coded for RSI-MRI cellularity index, D) “Digital prostate map” grid overlay color-coded for Gleason grade, E) H&E-stained WM histopathological prostate section with tumor area(s) outlined, F) Plots for each case of the mean RSI-MRI signal corresponding to each histological Gleason grade based on voxel-level analysis. Error bars represent the standard errors of the mean. Blue outline in A&B indicates the correspondence of the histopathology slide to the MR image. Abbreviations: H&E, haematoxylin & eosin; MR, magnetic resonance; RSI, restriction spectrum imaging; WM, whole mount.

