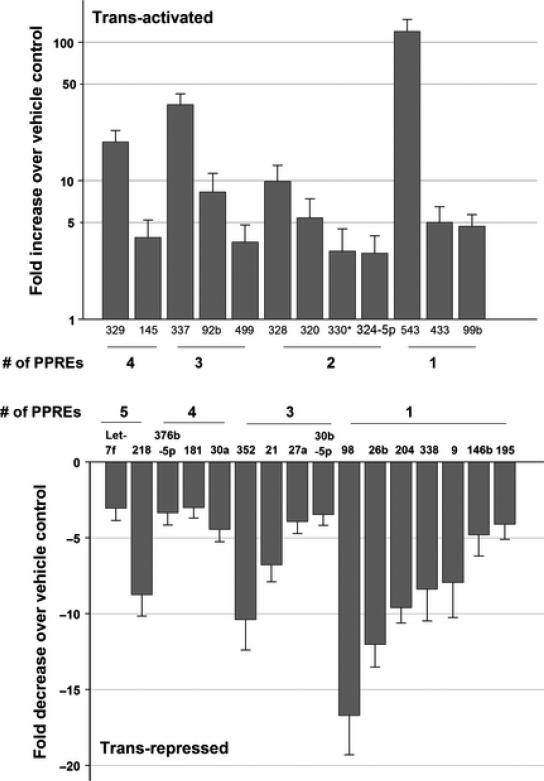
Fig. 1.
The miRNAs induced (top) and repressed (bottom) in the cerebral cortex following PPARγ activation. The bars represent mean fold changes in rosiglitazone group over vehicle group (n = 6/group). The # of PPREs in the promoters of each miRNA was indicated in the bottom. The promoter data is not available for 2 miRNAs activated (miR-23a-5p and miR-96) and 2 miRNAs suppressed (miR-137 and miR-29b) by rosiglitazone treatment and hence these miRNAs are not shown in the figure.

