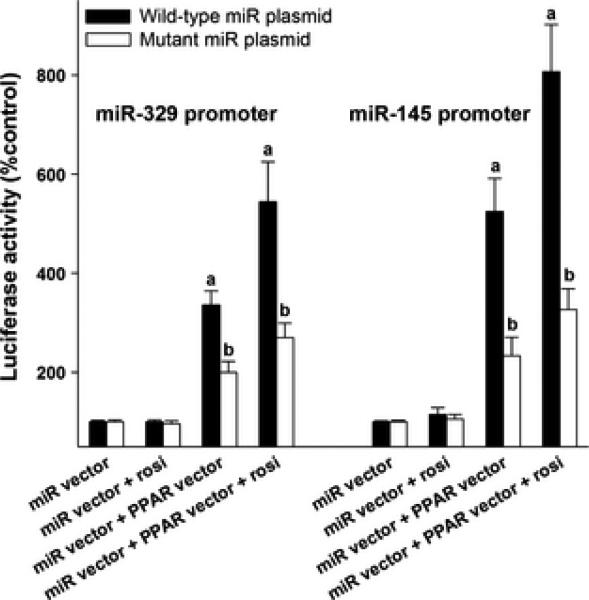
Fig. 3.
Induction of miR-145 and miR-329 expression by PPARγ. In both cases, the PPREs are present within 1 KB from the TSS. Cells were cotransfected with a PPARγ expressing vector together with miR-145 or miR-239 promoter vectors. Mutated vectors (all 4 PPREs mutated) served as control for each miR vector. Values are mean ± SD of n =4/group. Each transfection was carried out in triplicate. *p<0.05 compared to miR vector alone group in each case by ANOVA with Tucky's multiple comparisons post-test.

