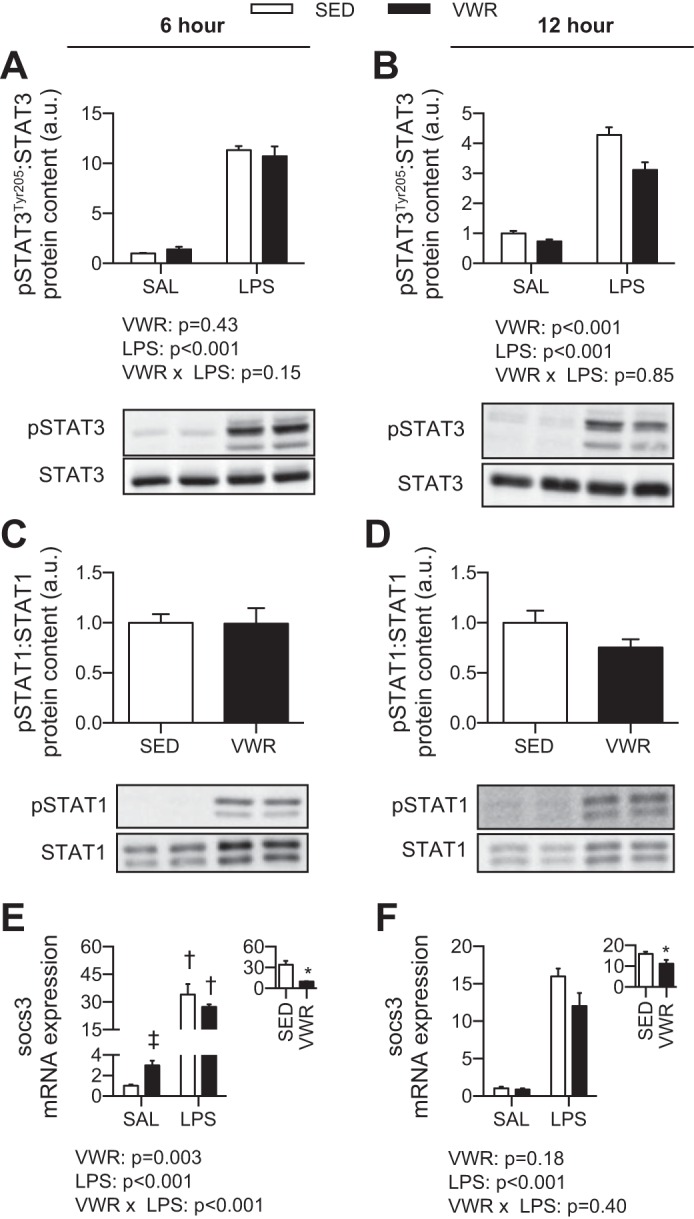
Fig. 4.

Effect of voluntary wheel running and LPS on the phosphorylation of STAT3 (A) and STAT1 (B) and the mRNA expression of SOCS3 (C). Two-way ANOVA P values are indicated below figures, with post hoc testing of interaction. †P < 0.05 indicates LPS different within SED or VWR. ‡P < 0.05 indicates VWR different within SAL or LPS group. Inset: fold change compared with SAL control. *P < 0.05 for t-test between SED and VWR groups.
