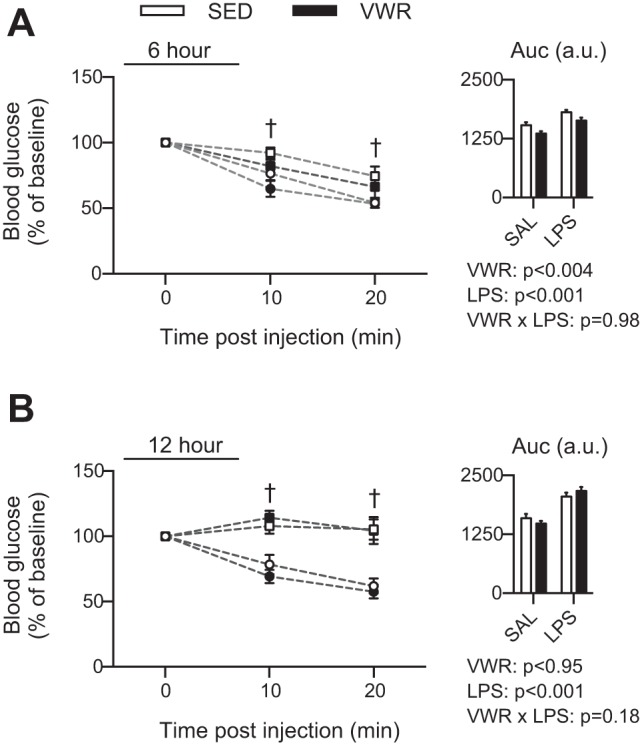
Fig. 7.

Time course of blood glucose response to an insulin injection at 6 h (A) and 12 h (B) after LPS injections. Insulin tolerance test (ITT) curve shows SAL-injected (circles) and LPS injected (squares), and data were normalized to baseline levels. Inset indicates area under curve (AUC). †A three-way ANOVA interaction post hoc indicates LPS different from SED for indicated time points at P < 0.001.
