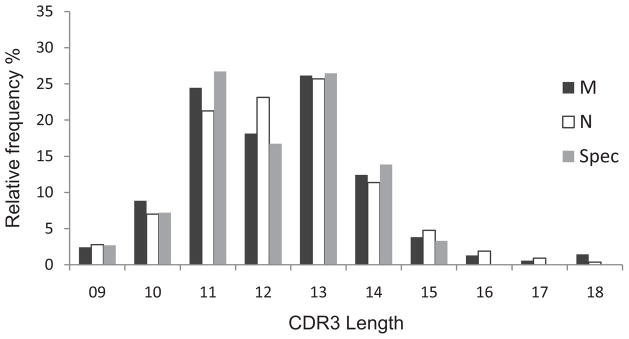
Figure 2. CDR3 length distribution of the BV19 clonotypes.
The percent of clonotypes (open bars) or observations (closed bars) are shown for CDR3 lengths representing more than 1% of the data. Spectratype data from the same samples was averaged and shown as grey bars with standard deviations. The number of observation data is equivalent to a virtual spectratype .

