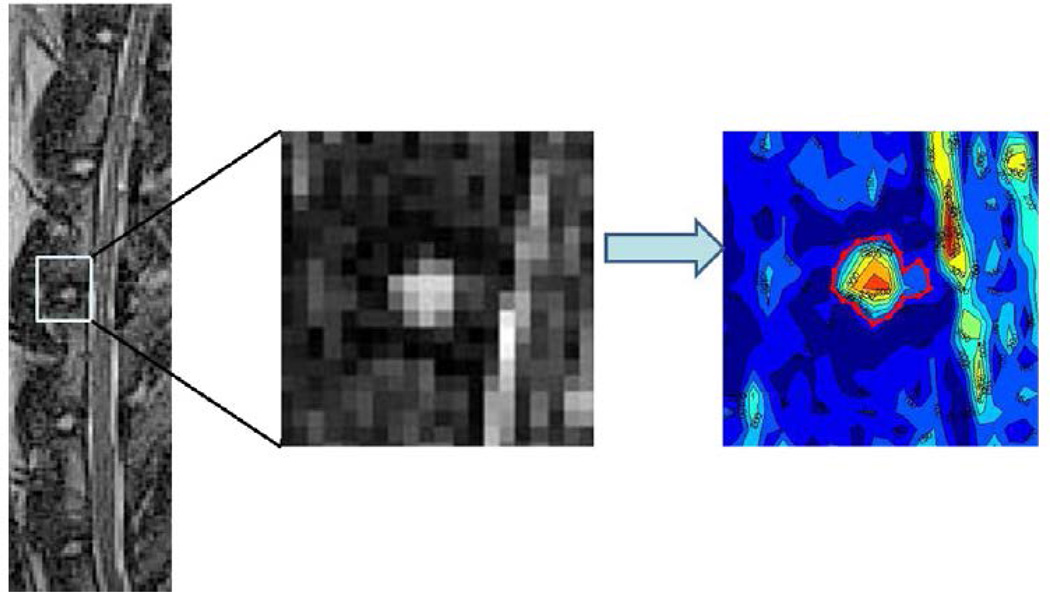
Fig. 3.
Contour segmentation. (Left) Midsagittal T2-weighted magnetic resonance imaging of the lumbar spine at time point 0 and (Middle) magnified image of the L3–L4 disc. A previously validated automated computer program applies signal intensity isolines to the area around each disc. (Right) The largest concentric circle, representing the nucleus pulposus, is selected as the region of interest.

