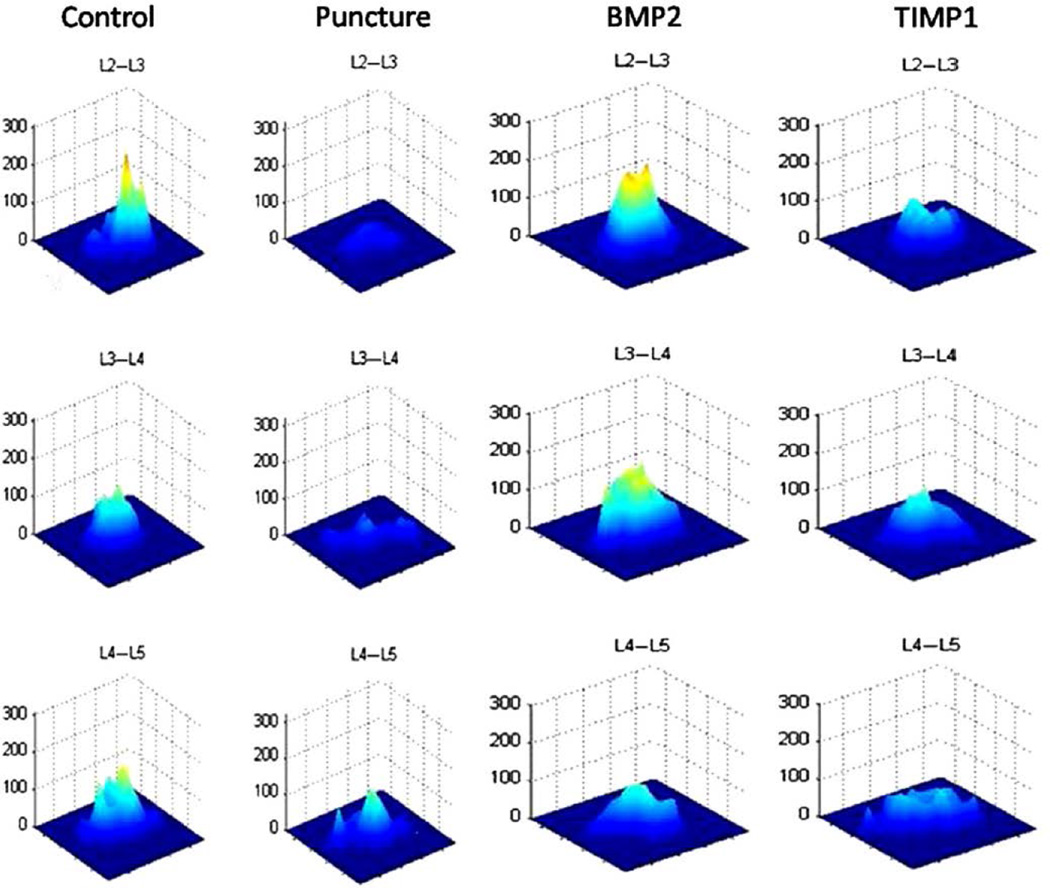
Fig. 7.
T2 maps. The midsagittal magnetic resonance image is selected for each disc, and a contour segmentation program outlines the disc space as the region of interest. Signal intensity for each pixel across echo times (12, 24, 36, 48, and 60 ms) is plotted on the vertical axis, with the distance from the center of the disc plotted on the horizontal axis. The slope of the map reflects disc degeneration. A steeper slope represents a greater contrast between bright and dark signal intensity within the disc, demonstrating relative heterogeneity within the nondegenerated disc. A flatter slope represents a decreased contrast between bright and dark signal intensity in the disc demonstrating relative homogeneity (suggestive of degeneration). Representative T2 maps obtained at 12 weeks are depicted.

