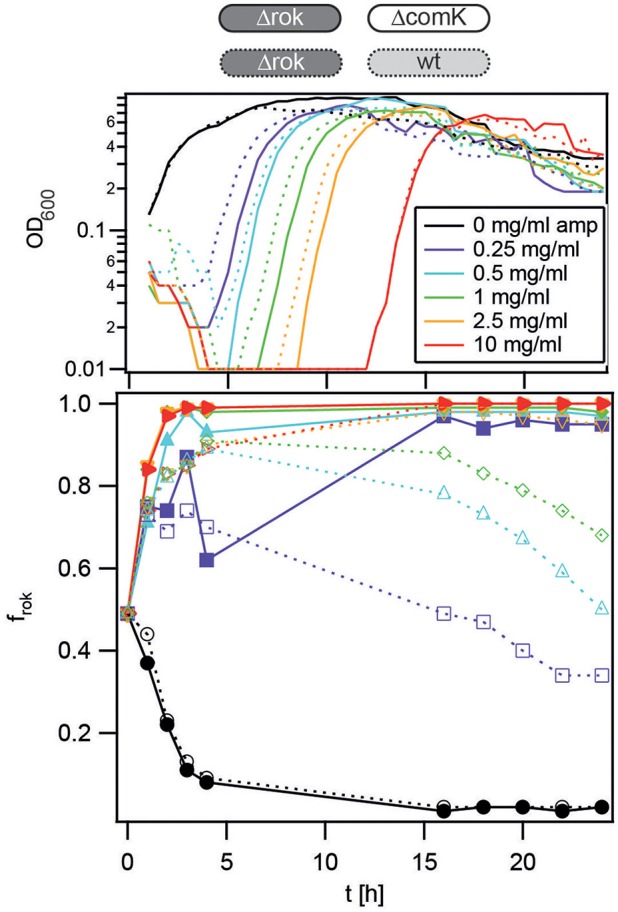
Figure 7.

Competition dynamics between wt and Δrok in the presence of ampicillin (amp). Competitors were grown separately to T2, diluted into fresh competence medium containing antibiotics as detailed in the graphs, and mixed in a 1:1 ratio. At t = 1 h, antibiotics were washed out and fresh competence medium was added. Upper graphs: growth curves (optical density of both competitors). Lower graphs: fraction of hyper-competent Δrok gfp (Bs141) cells competing against ΔcomK (Bs075, full lines, filled symbols) and Δrok gfp cells competing against wt (BD630, dotted lines, open symbols). Each graph is a representative result of at least three independent experiments.
