Figure 6.
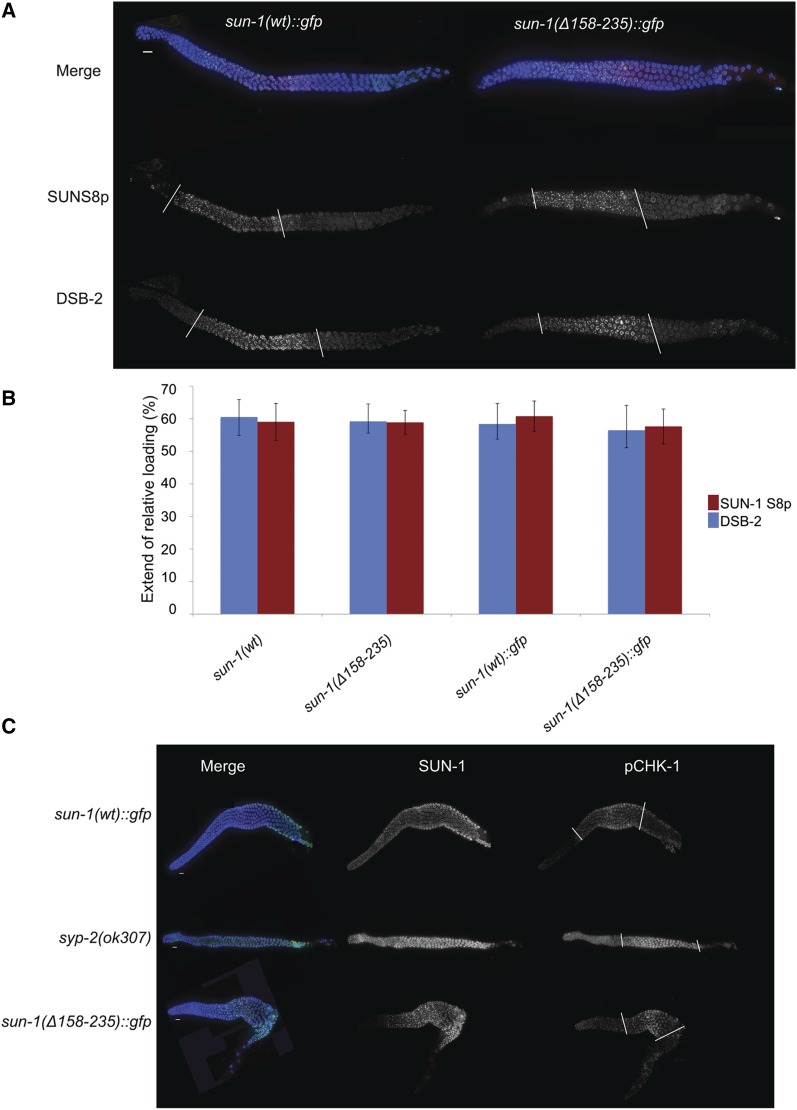
Early meiotic prophase I events progress with wild-type dynamics in the absence of cc motifs. (A) DAPI (blue), SUN-1S8p (green), and DSB-2 (red) staining in wild-type and mutant germ lines; with no differences. White bars mark the zone containing phosphorylated SUN-1 and the zone of DSB-2 localization. (B) Graph showing quantification of the zone positive for phospho-SUN-1S8 and DSB-2. The region positive for these markers was normalized to gonad length from meiotic onset until diplotene. There is no significant difference between wild type and mutant (two-tailed t-test, P > 0.581). Bars represent SD Psun-1(wt)::gfp II; sun-1(ok1282) V, n = 11; Psun-1(Δ158–235)::gfp II; sun-1(ok1282) V, n = 6; sun-1(wt), n = 6; Psun-1(Δ158–235) II; sun-1(ok1282) V, n = 6. (C) Costaining of GFP (to mark SUN-1) and pCHK-1. White bars mark the zone containing pCHK-1. Note the higher signal intensity and extension of the zone containing pCHK-1 until the end of pachytene in the absence of synapsis compared with other genotypes. Bar, 10 µm.

