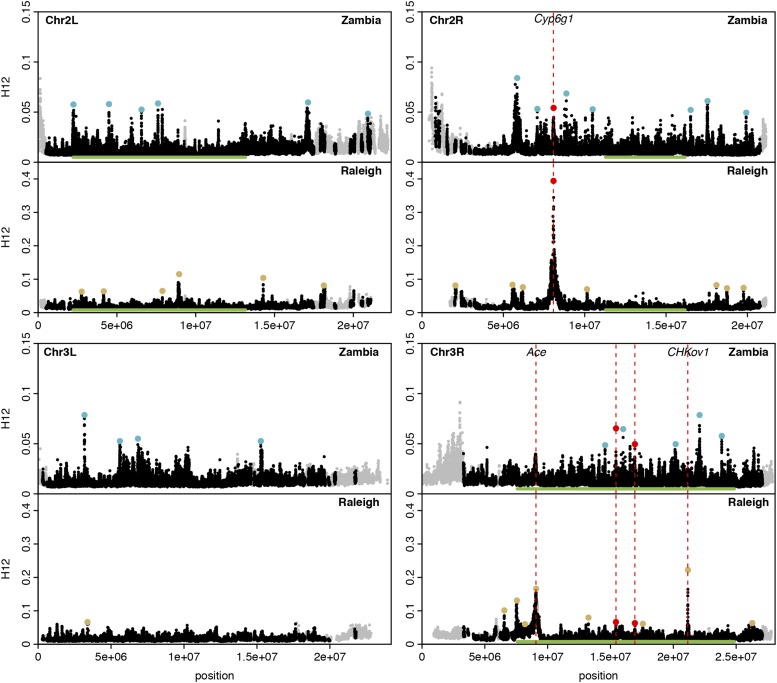
Figure 2.
H12 scan in Zambian and Raleigh data. We performed an H12 scan in Zambian data with windows of size 801 SNPs downsampled to 401 SNPs and in Raleigh data with windows of size 401 SNPs. Each data point represents the H12 value calculated in an analysis window centered at that particular genomic position, with window centers separated by 50 SNPs. Gray points indicate regions on the autosomal arms with recombination rates lower than 0.5 cM/Mb (Comeron et al. 2012) excluded from our analysis. Green bars indicate common inversions. There are multiple overlapping inversions on chromosome 3R. Red, blue and yellow points highlight the top 25 H12 peaks in each respective scan relative to the median H12 value in the data. Red points indicate peaks that overlap both scans whereas blue and yellow points indicate peaks unique to Zambia and Raleigh, respectively. The three highest peaks in the Raleigh scan correspond to known cases of soft sweeps at Ace, CHKov1, and Cyp6g1. We also observed peaks at Ace and Cyp6g1 in the Zambian scan, but these did not rank as highly because the adaptive alleles at these loci were at lower frequencies at these sites. See Figure S5 for a higher-resolution H12 scan.

