Figure 3.
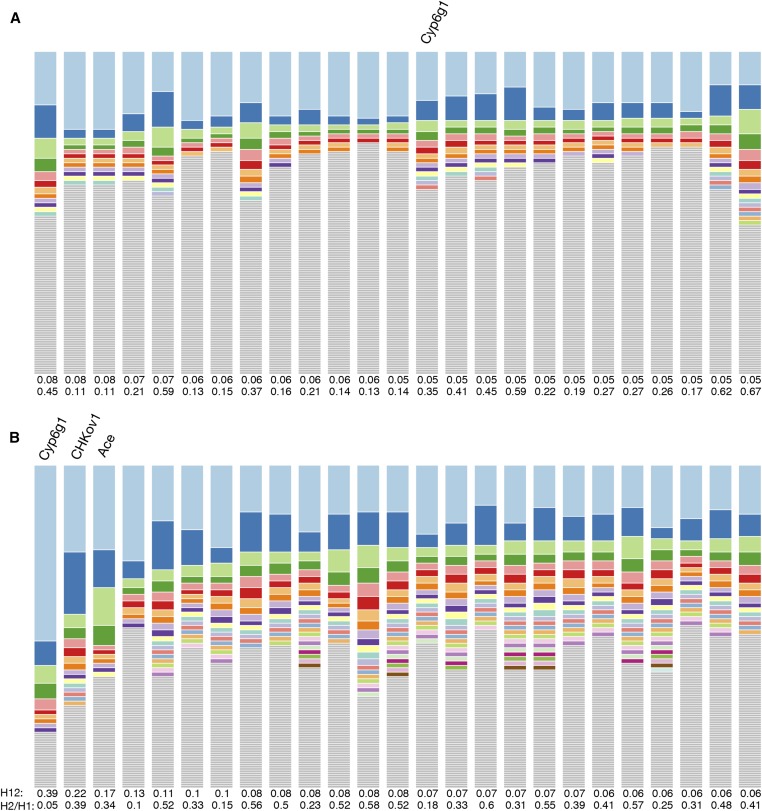
Haplotype frequency spectra for the top 25 H12 peaks in Zambian and Raleigh data. Shown are haplotype frequency spectra for the top 25 peaks in the (A) Zambian scan conducted in 801 SNP windows downsampled to 401 SNPs and the (B) Raleigh scan conducted in 401 SNP windows. For each peak, the frequency spectrum corresponding to the analysis window with the highest H12 value was plotted. The height of the top shaded region (light blue) in each bar indicates the frequency of the most prevalent haplotype in the sample of 145 individuals, and heights of subsequent colored bars indicate the frequency of the second, third, and so on most-frequent haplotypes in a sample. Gray bars indicate singletons. In Zambia, sweeps reach a smaller partial frequency than in Raleigh. Many peaks in the Zambian data have multiple haplotypes present at high frequency, indicative of soft sweeps; and many peaks have a single haplotype dominating the haplotype spectra, indicative of hard sweeps. In Raleigh all sweeps have multiple haplotypes at high frequency consistent with signatures of soft sweeps.

